Product improvements
Make the most out of your qualitative feedback data with our Reporting API

Nowadays, data seems like (or possibly even is) one of the most valuable assets you can own as a company. However, without the analytical infrastructure which enables you to draw insightful conclusions, it's not worth anywhere near as much. According to Litmus, a lack of quality data & integration is the email marketer's biggest challenge this year. We'd love to give you a helping hand on this.
We believe that combining qualitative feedback data with email and customer data opens up endless possibilities for you to excel in creating the ultimate customer experience. I will show three examples of how you could make your data work for you with the help of our Reporting API.
1. Combine customer feedback statistics
In your CloseAlert portal you have an overview of the feedback received, categorized per mailing and/or journey, which enables you to analyze your data quick and easy. However, we also think that combining all of these statistics in a monitoring tool can give you even more in depth insights on your feedback. How interesting would that be?
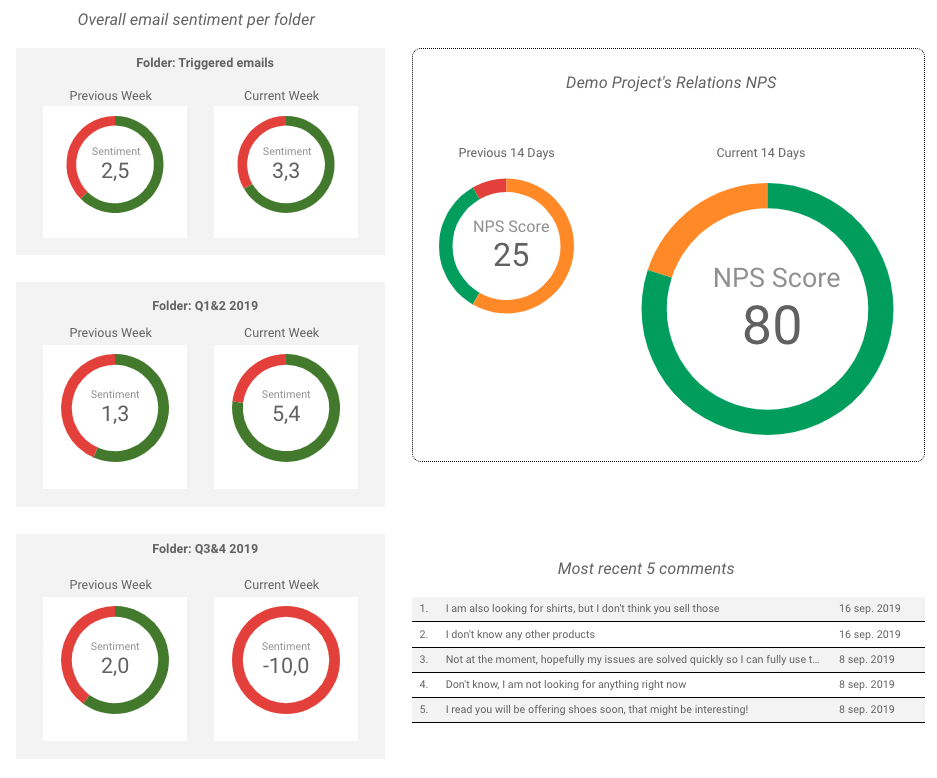
We've set-up a dashboard in Google Data Studio to give you an idea of how you can combine all of your qualitative data and elaborate on it:
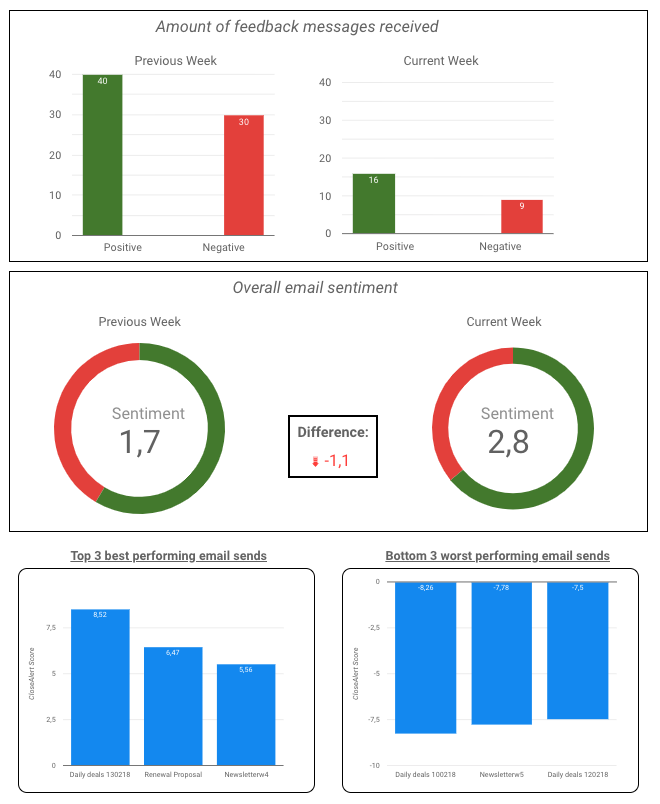
A dashboard like this will help you with drawing quick conclusions on what actions should be undertaken. Looking at this dashboard, I can e.g. conclude the following:
- I should plan a moment to analyze and improve my three worst performing campaigns since they score too low in my opinion.
- I should take time to analyze the folder 'Q3&4 2019' and find out why the sentiment score has decreased this much within one week time.
Besides saving precious time, this dashboard also enables you to share the valuable feedback with your colleagues quick and easy. Show them that you rocked your campaigns this week!
Combine feedback with traditional email statistics
Furthermore, you can add your traditional email statistics to this dashboard as well and create an overview of the overall performance of your emails. You will then have e.g. the email's open rate, click rate and sentiment score all in one place. This will enable you to draw conclusions on the overall email performance very easily. For example, if your click-through-rate is remarkbly low, you can immediately check upon your email sentiment and the corresponding comments to see if you can find out the reason behind it. Does it get any better than this?
2. Enrich customer profiles
At CloseAlert, we strongly believe in reviewing feedback per email send to analyze and understand which campaign excels and which one needs improvements. However, in order to create personalized experiences, using this feedback to enrich your customers' profiles is a rather interesting addition to this.
By using our API, you can import feedback into your customer relationship management (CRM) platform and link responses to customers. In this way, you're able to draw conclusions on e.g. the engagement (amount of feedback messages) or overall sentiment (division of positive and negative messages) of one individual customer.
This data can subsequently be used in several smart ways. Think about asking your top 10% most engaged customers to leave a review on your website (the bigger the chance of a high response rate) or treating your 5% most satisfied customers with a discount on their next order.
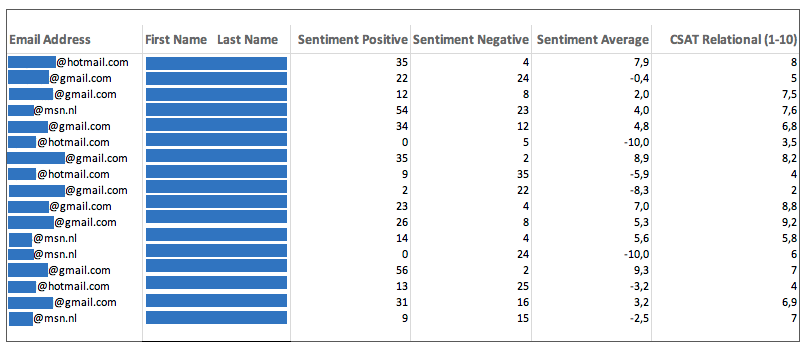
Below you find an example of how this could look like in your CRM. In this overview, four columns are added to the customer profile page, providing you with the following information:
- Amount of positive messages
- Amount of negative messages
- Average email sentiment
- Average relational customer satisfaction score
3. Automatically trigger follow up campaigns and create logic
Eventually, a large collection of data isn't automatically going to improve your customer relationships. However, by giving this data a human touch, you will get closer to your goal. By acting upon your data in the right moment and with the right doze, you can create rather relevant customer journeys and eventually strenghten the customer relationship.
Once you have your data all set in your CRM, you can start designing automatic triggers and create logic, based on customer feedback. I will show two examples to give you an idea.
As a gym you want to keep your customers informed and involved. In your welcome journey, you can ask for the reason they work out:
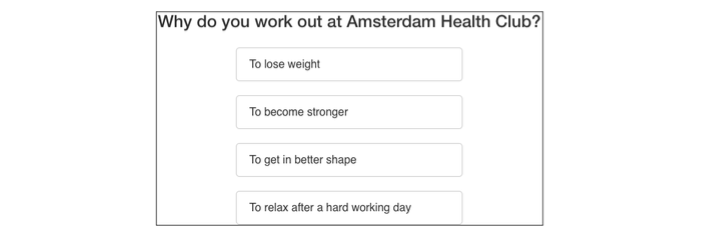 Once your customers show their preferences, you can create segments and send campaigns with suitable information for that particular person.
Moreover, if a respondent leaves negative feedback on your newsletter, you can create a follow-up question and ask them what they do like to read in your emails. Exclude the customer from this flow and include him/her in one that suits his/her preferences better.
Conclusion
It can be concluded that the base of a strong customer experience is the golden combination of insightful data and a human touch. So, listen to your customers, analyze their opinions and act like you truly know your customers' preferences... Or do you, by now, actually know them?
N.B. Are you using CloseAlert in combination with Google Data Studio and would you be interested in creating the dashboard as shown in paragraph one? Please let us know and we'll share the instructions with you.
-
Written by Alvin Vogelzang
-
Get in touch with Alvin Vogelzang
alvin@closealert.com